Climate Change Initiatives and Response to the TCFD Recommendations
Climate Change Initiatives and Response to the TCFD Recommendations
Endorsement of the Recommendations of the Task Force on Climate-Related Financial Disclosures
On May 20, 2022, we announced our endorsement of the Recommendations of the Task Force on Climate-related Financial Disclosures (TCFD).
Governance
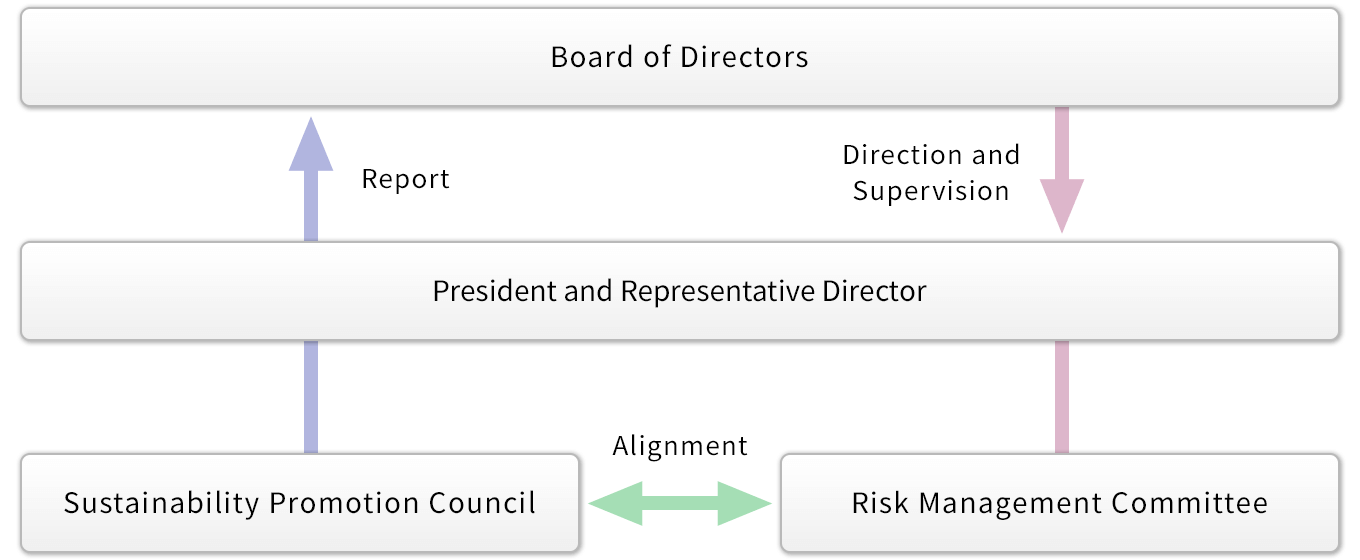
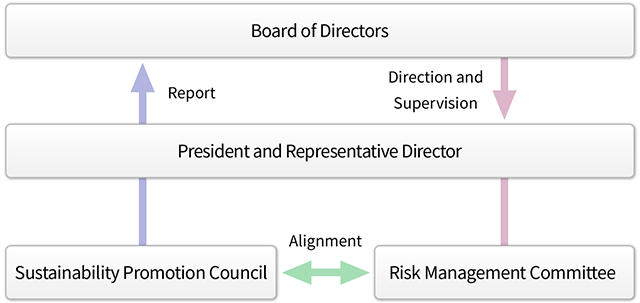
The Group regards responding to climate change and realization of a sustainable society as important management issues. The Sustainability Promotion Council was established to discuss medium- and long-term initiatives and orientation related to materiality, as well as to promote specific measures across the Company to address ESG issues, promote CSR, achieve carbon neutrality, etc. The Sustainability Promotion Council meets quarterly.
The Sustainability Promotion Council is chaired by the President and its membership comprises executive officers. It reports to the Board of Directors for direction and supervision.
Risks and Opportunities
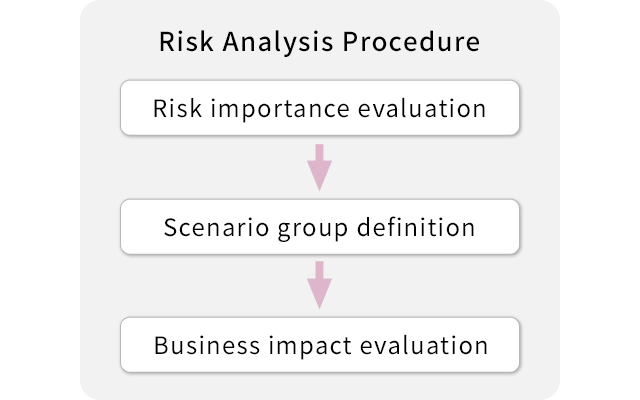
We examined “climate-related transition and physical risks” and “climate-related opportunities through climate change mitigation and adaptation solutions” according to the TCFD classifications.
Scenario analysis was conducted for 1.5℃ and 4℃ scenarios, with reference to the International Energy Agency (IEA) and the Intergovernmental Panel on Climate Change (IPCC). We have conducted a scenario analysis as shown on the following page, and the results confirmed that our strategy has resilience with regard to the response to each risk and opportunity.

Scenario analysis (GHG emissions are in CO2 equivalent)
Prerequisites: - We examined risks and opportunities expected in 2030.
- Financial impacts of climate change have been estimated.
| Category of Risks and Opportunities | Overview of Risks and Opportunities | 1.5℃ Scenario | 4℃ Scenario | PACIFIC METALS’s Response | |||||
|---|---|---|---|---|---|---|---|---|---|
| Financial Impact |
Possibility | Financial Impact |
Possibility | ||||||
| Risks | Transition | Policies and regulations | Higher energy costs for business operations (manufacturing and transportation) due to introduction of carbon tax | Large | High | Small | High |
|
|
| Higher risks and costs of procuring various raw materials due to higher fossil fuel prices caused by changes in the supply-demand balance resulting from climate change, unstable supply due to unseasonable weather and other factors, and a higher renewable energy levy | Small | Low | Large | Medium | |||||
| Market and technology transition | Greater customer demand for decarbonization. Lower product competitiveness (e.g., declining market share) if the Company’s response to decarbonization is insufficient | Large | Medium | Medium | Low |
|
|
||
| Higher Ni prices due to higher demand reflecting shift to EVs, leading to replacement of raw materials for stainless steel by less expensive alternative metals | Large | Low | Large | Low |
|
|
|||
| Reputation in the market | Preference for ESG-responsive suppliers in the supply chain, leading to damage to corporate value and additional ESG-related costs | Large | Medium | Small | Medium |
|
|
||
| Declining value in capital markets (e.g., share price declines) because of failure to respond to climate change information disclosure requirements | Large | Medium | Small | Low | |||||
| Physical | Acute | Physical damage to production sites and the supply chain, causing suspension of operations and logistics, resulting in lost profits and additional costs. | Small | Low | Small | Medium |
|
|
|
| Chronic | Additional production costs due to changes in properties, such as increased moisture content of raw materials, because of longer rainy seasons in the regions where resources are procured. | Small | Medium | Small | High | ||||
| Opportunities | Resource efficiency | Expanded use of recycled metal resources (alternative to metal resources), which produce less GHG emissions and show higher manufacturing efficiency than natural resources | Large | Medium | Large | Medium |
|
|
|
| Energy source | Innovation in the manufacturing process, which results in a substantial decrease in fossil fuel use and a reduction in energy costs and in turn reduces GHG emissions and improves the impact of carbon pricing | Large | Medium | Medium | Medium |
|
|
||
| Products and services | Innovation in the manufacturing process, which contributes to GHG emission reductions in customers’ supply chains and increases product competitiveness | Medium | Medium | Small | Low |
|
|
||
| Resilience | More flexible and speedy response due to the transition of active engagement in ESG issues to company-wide strengthening of governance, leading to support and cooperation from investors and other stakeholders, increased corporate value, strengthening of business foundation, and further business expansion | Medium | Medium | Small | Medium |
|
|
||
• 1.5℃ Scenario: A scenario where continued efforts are made to limit the average temperature increase to 1.5℃
• 4℃ Scenario: A scenario where no measures are taken and the situation takes its natural course.
Process Electrification Initiative
We are researching and developing a new electrified calcination process in nickel ore smelting. If we can replace coal burning with electrically generated microwaves, the primary source of CO2 emissions in the calcination process can be eliminated.
Using standard microwave bench equipment, we achieved a reduction reaction rate matching that of our current rotary kilns. This achievement will allow us to significantly cut CO2 emissions from fossil fuels and save energy through improved thermal efficiency.
We will continue scaling up verification with the aim of introducing actual equipment in 2030.
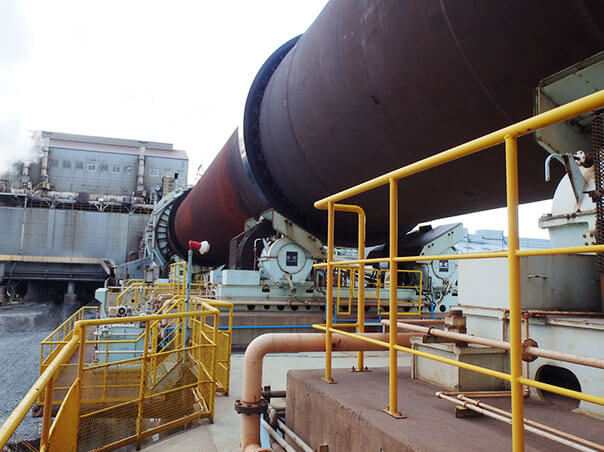
Current rotary kilns
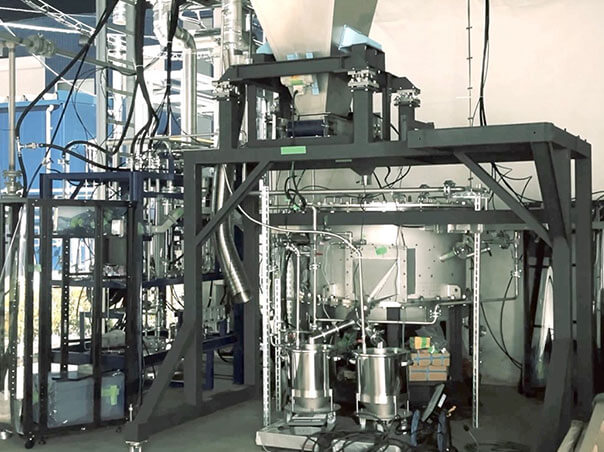
Standard microwave bench equipment
2024/5/10 Press Release
2023/8/23 Press Release
Risk Management
The Group has established the Risk Management Committee for company-wide risk management, including risks related to climate change. The Risk Management Committee is chaired by a director appointed by the President and its membership comprises executive officers and general managers. It meets quarterly to conduct routine risk management (risk identification, evaluation, monitoring, etc.). For risk countermeasures, we prioritize risks based on likelihood and impact, and we engage in risk mitigation activities for priority risks and manage progress.
The Risk Management Committee reviews “climate-related risks and opportunities” annually and the status of activities is reported to the Board of Directors at least once a year for direction and supervision. Matters affecting important sustainability issues are reported to the Sustainability Promotion Council.
Goals and Indicators
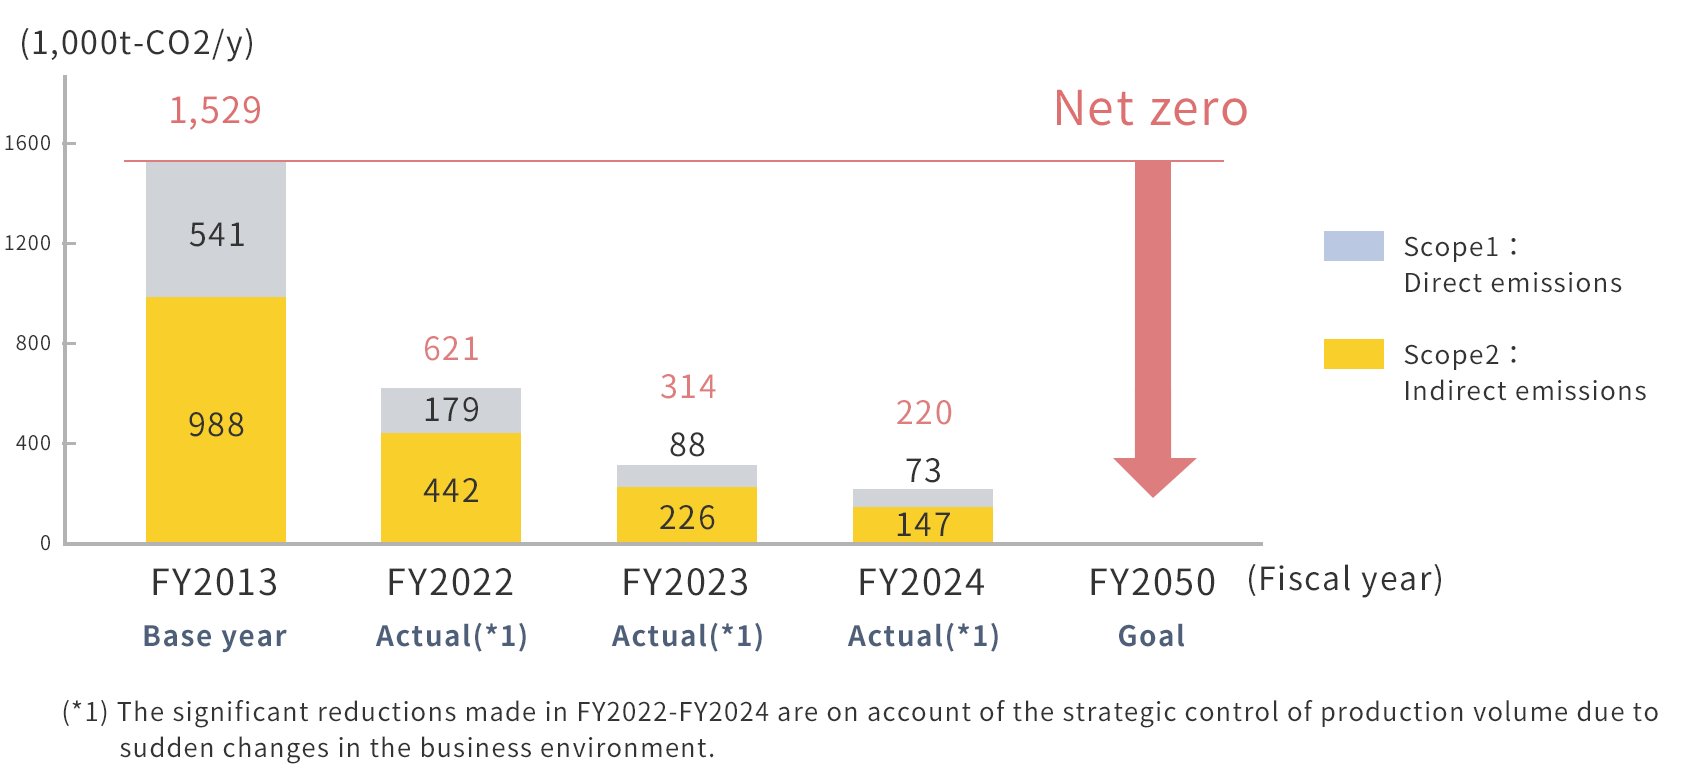
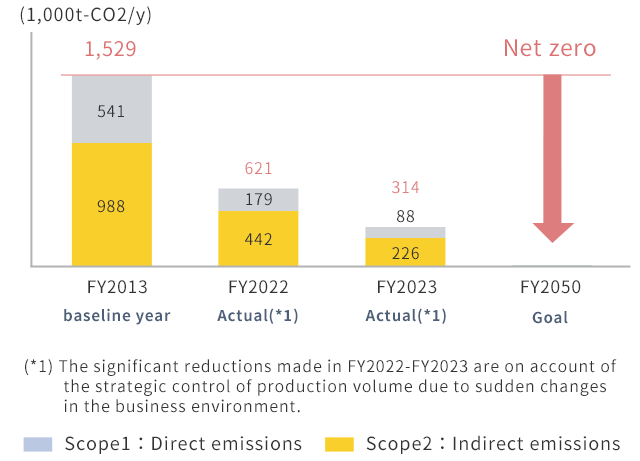
The Group’s goal is to reduce GHG emissions by at least 46% by FY2030 (compared to FY2013) and to achieve net zero emissions by FY2050.
Initiatives to Achieve the Goals
• Reduction of GHG emissions
To achieve carbon neutrality by FY2050, we will implement measures with clear targets, including use of carbon-free energy and introduction of new technologies.
Result of GHG emissions (CO2 equivalent)
• Scope 1 and 2 emissions
Starting in fiscal year 2024, this will include emissions from consolidated subsidiaries.
• Scope 3
Starting in fiscal year 2024, this will include emissions from consolidated subsidiaries.
The Company has calculated Scope 3 emissions based on the “Basic Guidelines on Accounting for Greenhouse Gas Emissions Throughout the Supply Chain (Ver. 2.7)” provided by the Ministry of Economy, Trade and Industry and the Ministry of the Environment. The total of Scope 3 Consolidated emissions in FY2024 was 74 kt-CO2. The category specific breakdown was Category 1: Purchased goods and services (10%), Category 3:Fuel-and energy-related activities not included in scope 1 or scope 2 (33%), Category 4:Upstream transportation and distribution (41%), and Category 13: Downstream leased assets (12%) accounted for about 96% of the total.
| Supply chain emissions [1,000 t-CO2/year] | ||
|---|---|---|
| FY2023 Emissions ratio (% *2) |
FY2024 Emissions ratio (% *2) |
|
| C1 Purchased goods and services | 4 (4%) | 7 (10%) |
| C3 Fuel-and energy-related activities not included in scope 1 or scope 2 | 36 (37%) | 25 (33%) |
| C4 Upstream transportation and distribution | 44 (46%) | 30 (41%) |
| C13 Downstream leased assets | 9 (10%) | 9 (12%) |
| Other than the above categories (the total of C2, C5-C9, C12) | 3 (3%) | 3 (4%) |
| Scope 3 total (*3) | 96 (100%) | 74 (100%) |
(*2)Emissions ratios are rounded to the nearest whole number.
(*3)C10, C11, C14, and C15 are not applicable.
Reference for emissions intensities:
1. the database on emissions intensities for calculating organizational greenhouse gas emissions, etc. through a supply chain (Ver. 3.5);
2. IDEA v2 (for supply chain greenhouse gas emissions calculations)
Non-fossil Electricity Ratio Goals
We set the following non-fossil electricity ratio goals to reduce GHG emissions from electricity.
| FY2030 | FY2050 | |
| Non-fossil Electricity Ratio Goals (%) | 50 | 100 |
|---|
Introduction of locally produced and locally consumed renewable energy (produced in Aomori Prefecture)
Pacific Metals has introduced locally produced and consumed renewable energy.
We utilize renewable energy generated at wind power plants within Aomori Prefecture to reduce greenhouse gas emissions.

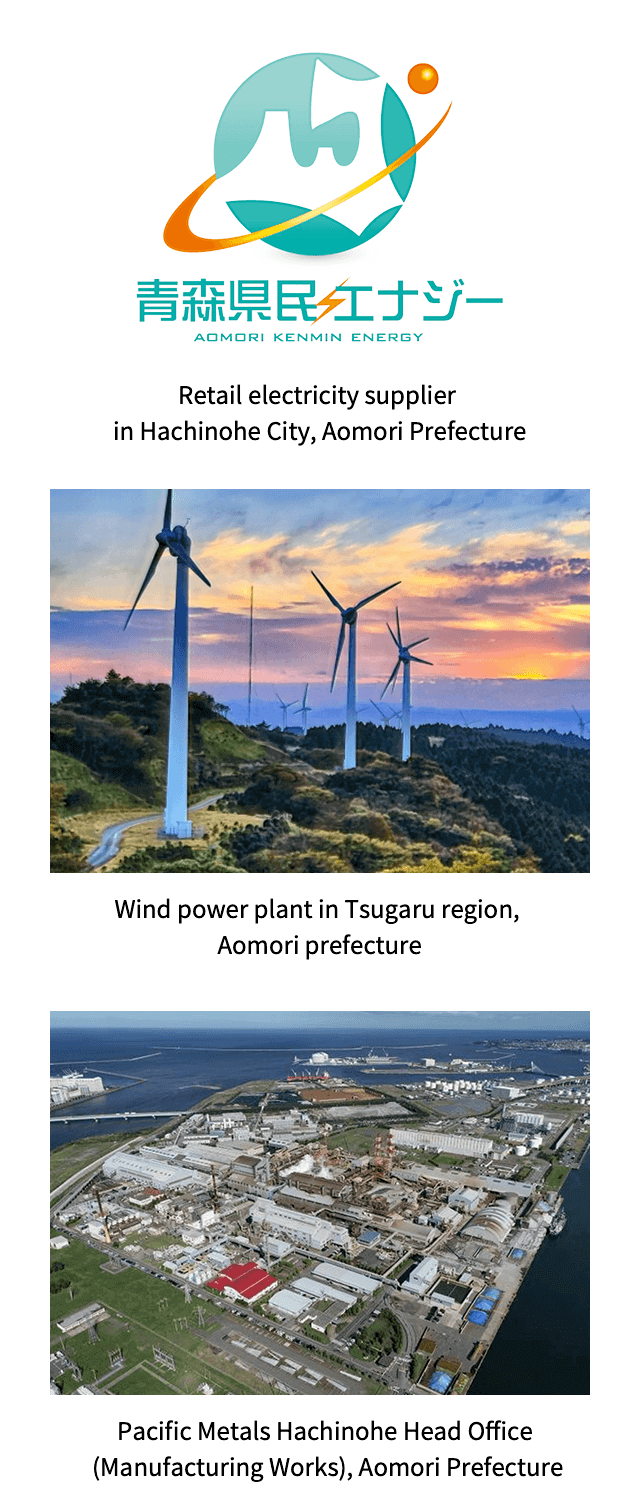
In 2025 (fiscal year), we will use 17,000MWh of renewable energy produced in Aomori Prefecture per year.